The dashboards
Four views, each answering one question a finance team actually asks.
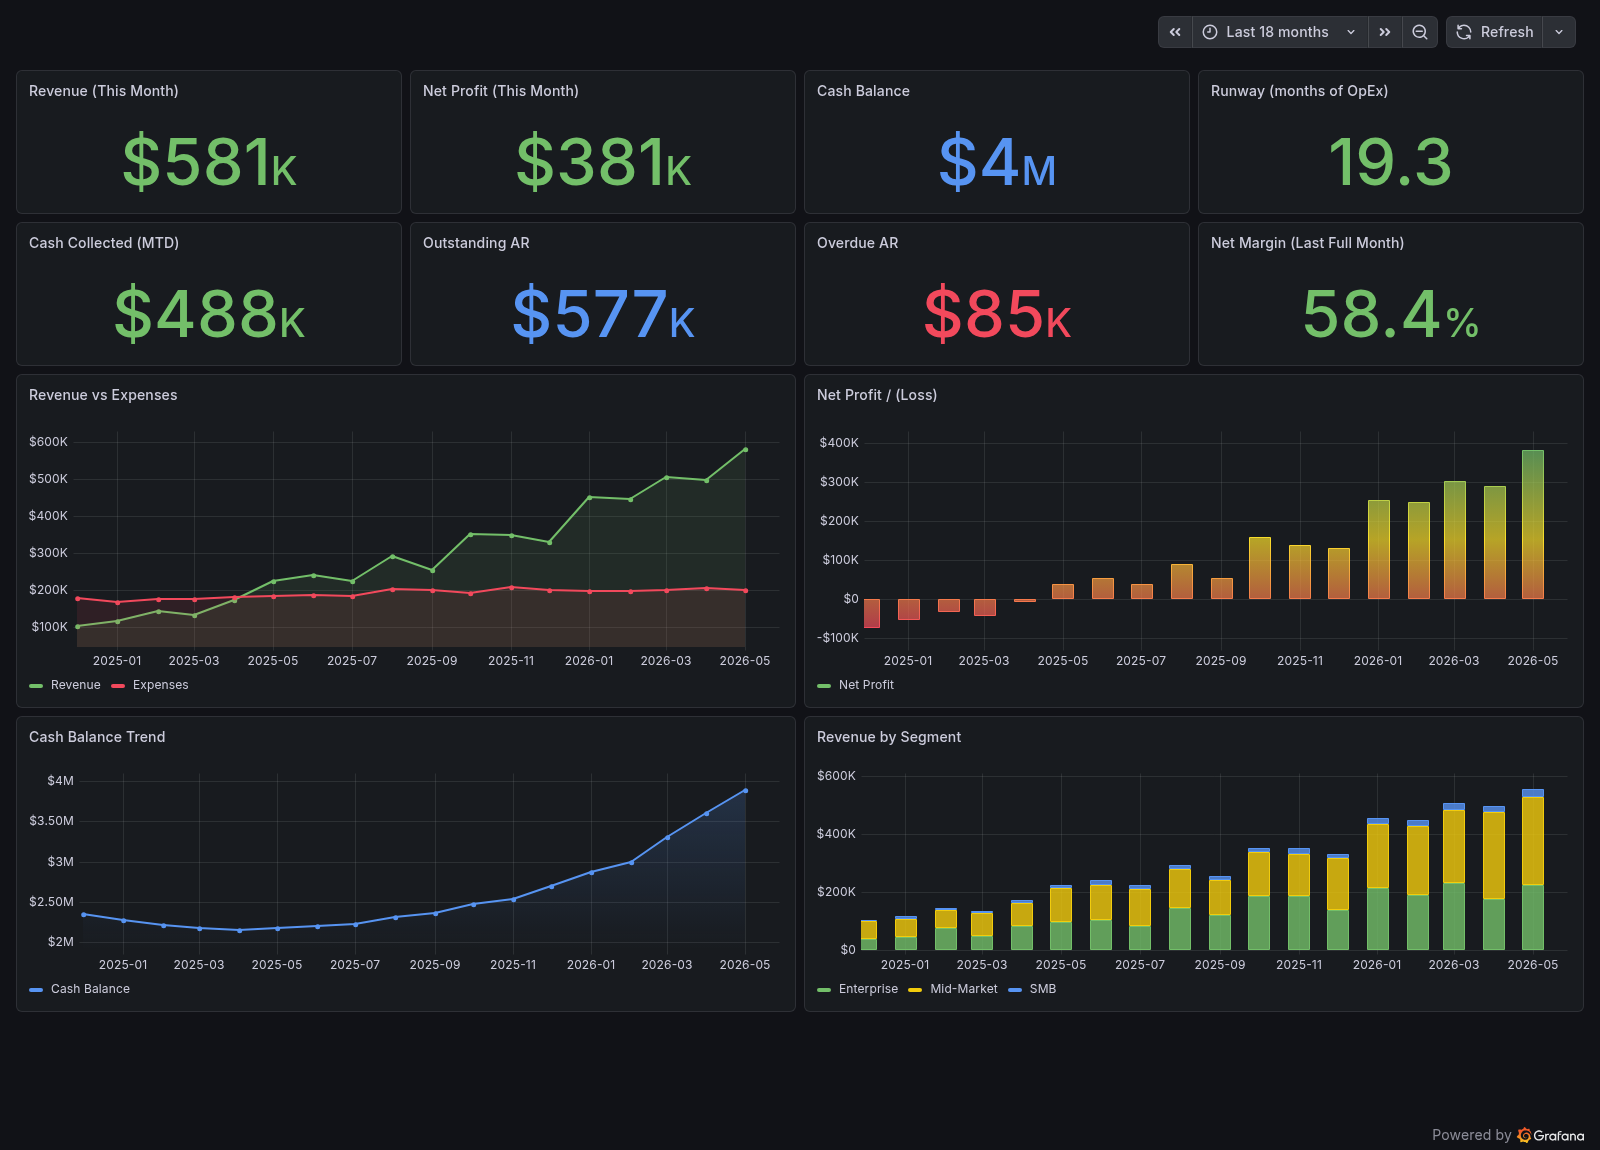
How is the business doing this month?
The headline read: revenue, net profit, cash balance, and runway up top, then revenue versus expenses, monthly profit, the cash trend, and revenue by segment below. The one screen you'd send the board.
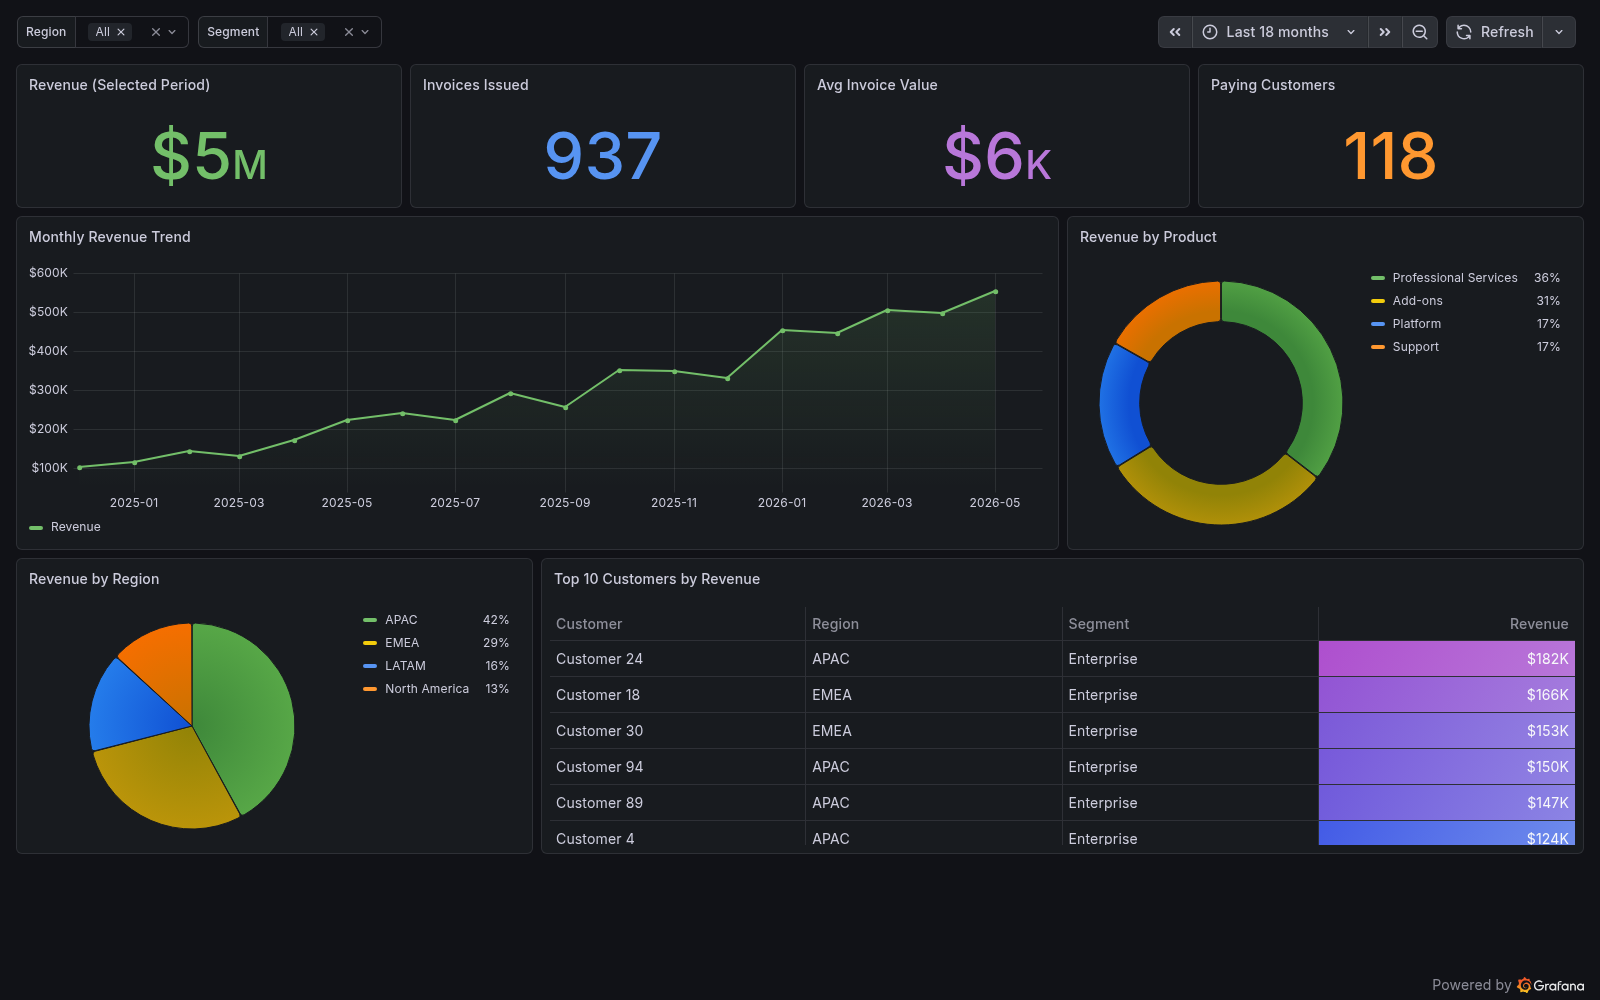
Where is revenue coming from?
Filterable by region and segment. Monthly revenue trend, revenue by product and region, and a ranked table of the top customers with color-graded values.
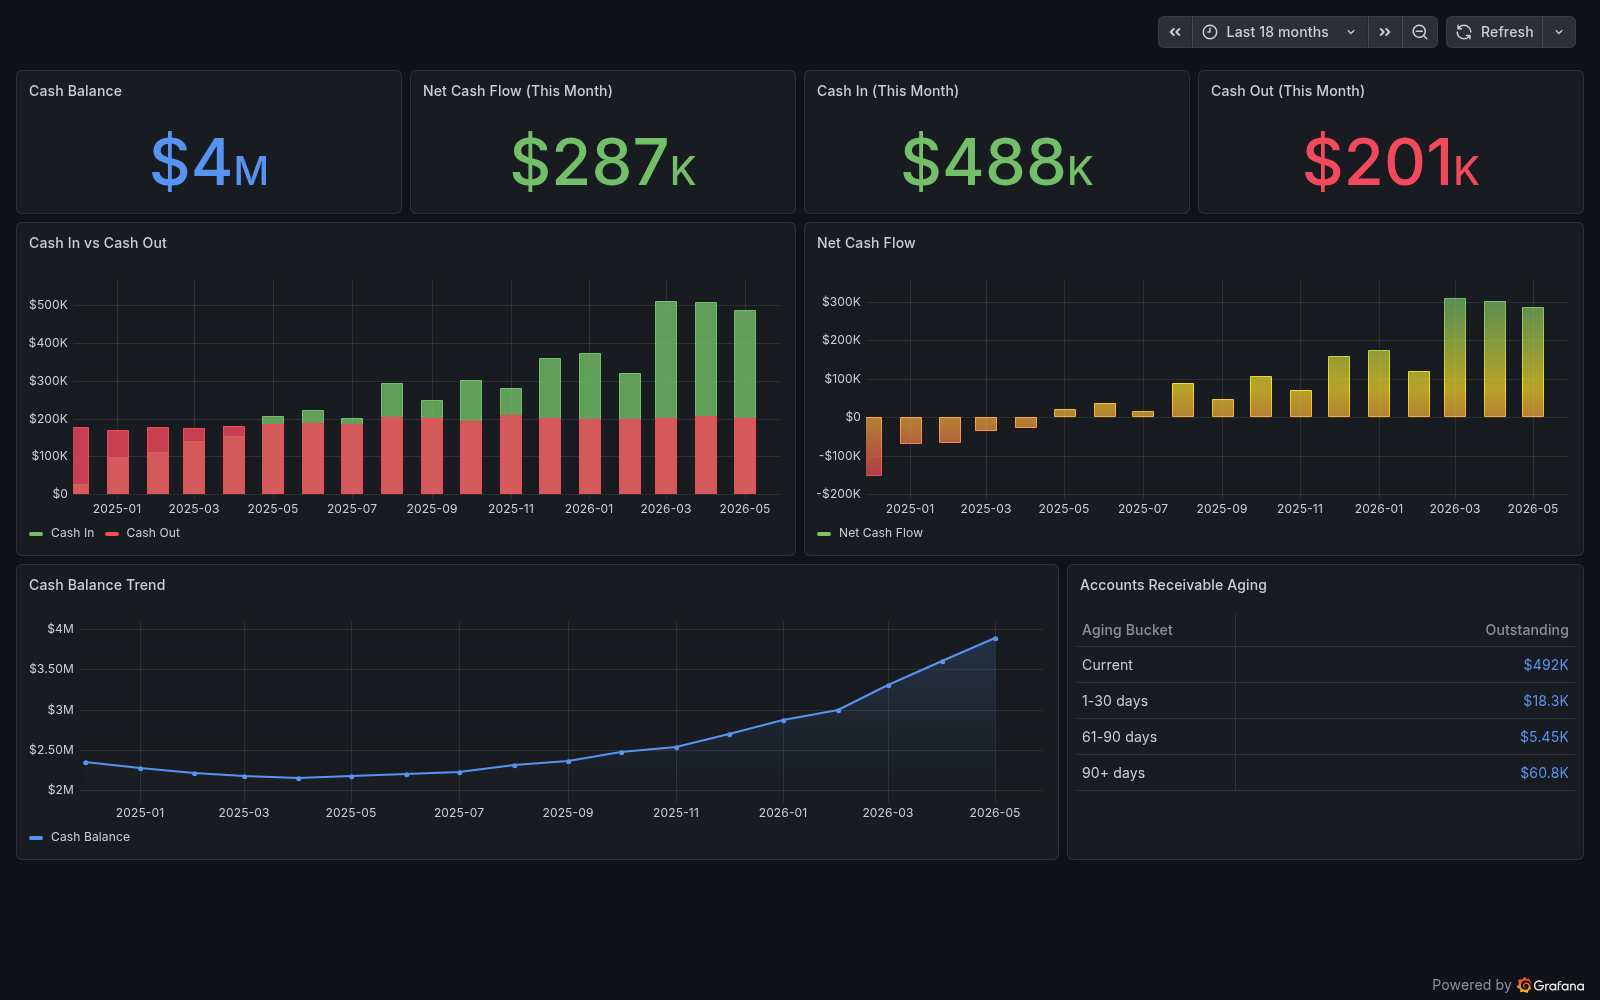
Are we cash-positive, and what are we owed?
Cash in versus cash out, net cash flow, the running balance, and an accounts-receivable aging table that flags the 90+ day bucket in red.
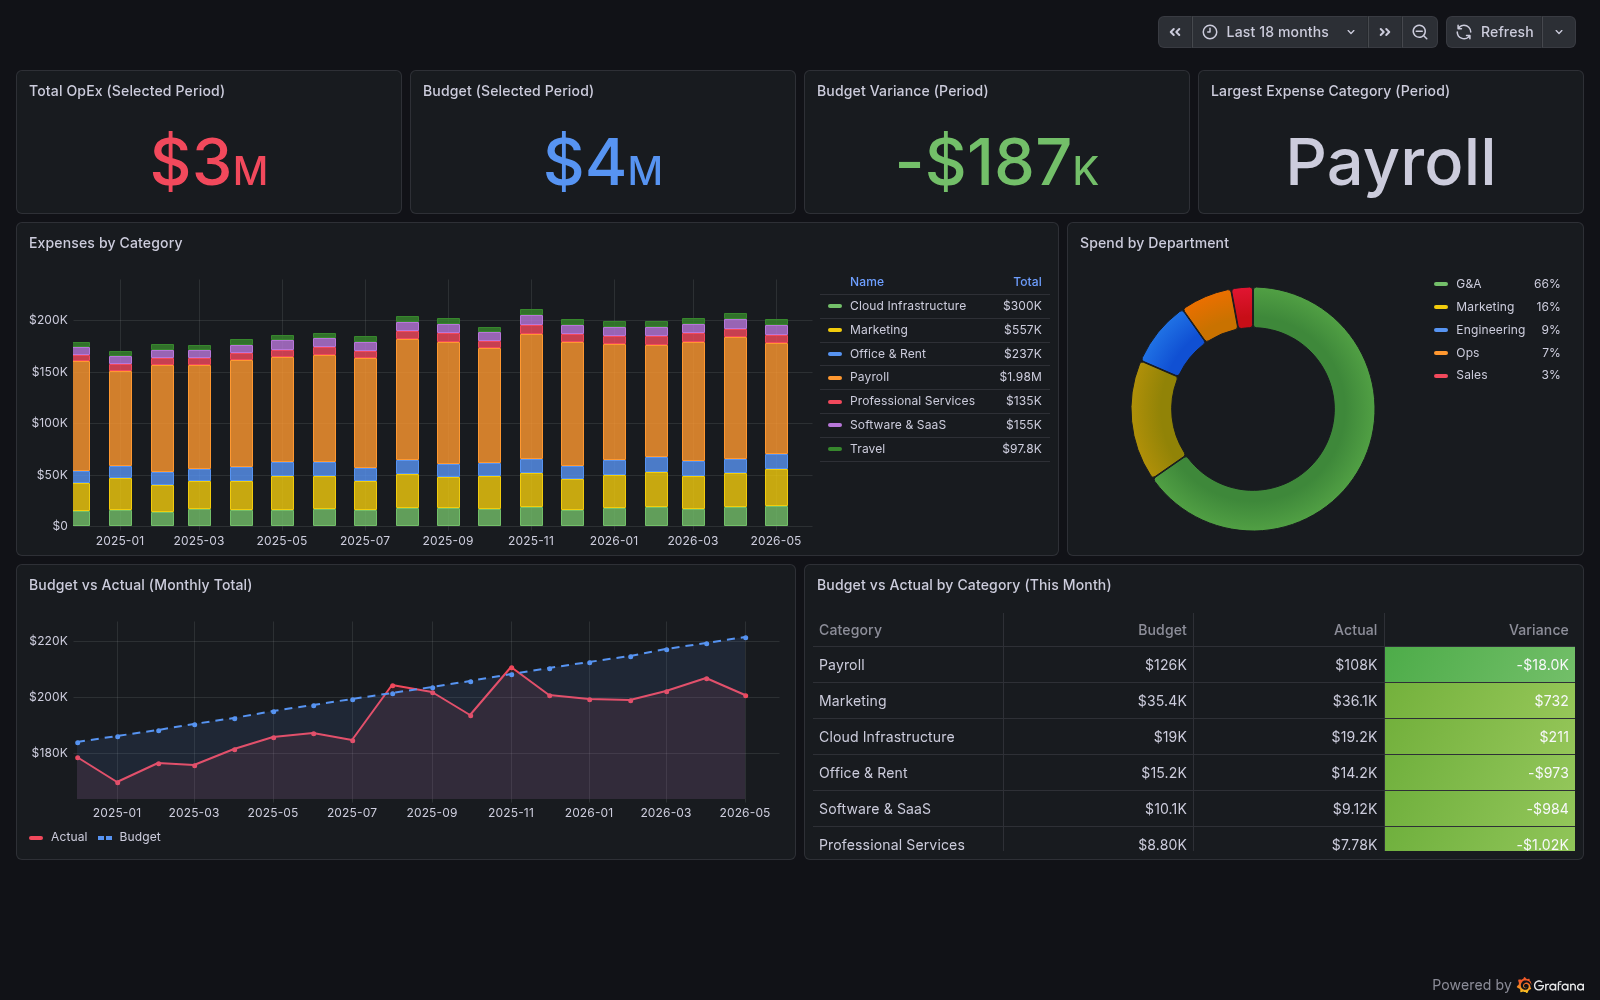
Are we on budget, and where is money going?
OpEx versus budget with variance, expenses stacked by category over time, spend by department, and a budget-vs-actual breakdown per category for the month.